Data Analytics Simplified
A Toolkit for Automated Workflows and Operational Efficiency
Imagine that you are the host of “Help! I Wrecked My House!” But instead of navigating through the debris of a DIY home renovation gone awry, you’re diving headfirst into a chaotic world of spreadsheets, rogue data streams, and a jumble of mismatched tools. The mission? To declutter, organize, and automate workflows, laying down the solid groundwork necessary for efficient reporting and data science. This is the life of a data analytics engineer.
Here on this blog, I’ll share insights, tips, tricks, and a robust framework designed to tackle the ever-evolving challenges of data engineering and analytics. Given that every company and initiative comes with its unique set of requirements, and considering the dynamic nature of data, you won’t find any one-size-fits-all guides here. Instead, I aim to share my thought process and problem-solving strategies to help you identify the most effective processes and tools for your projects.
You might find yourself here because you:
- Scaling Spaces: Just like a family outgrowing their starter home, your data needs have expanded beyond your current infrastructure’s capabilities. You’re at a crossroads, wondering whether to “love it” by upgrading your existing setup or “list it” by seeking out new solutions.
- Faced Analytics Ambitions: Perhaps you’ve invested heavily in analytics, hoping for transformative insights, only to find your initiatives stalling or underdelivering—much like the projects on “Rico to the Rescue.”
- Stepped Into a New Domain: Or maybe you’ve just stepped into the vast world of data analytics, seeking advice and tips on how to navigate this complex yet thrilling landscape.
No matter your situation, I’m here to equip you with the essential tools for your data analtyics toolkit, tailored specifically for the lean tech startup environment. Welcome!
Recent Posts
-
How to Dynamically get the Last Day of the Month in Python
Using pandas and the datetime module, you can dynamically get the last day of the month.
-
How to Setup PySpark in a Jupyter Notebook in 2 Steps on a Mac
-
How to Dynamically Convert Pandas Object Columns to a String Data Type
Since Pandas allows you to have mixed data type columns, converting them to a string data type can be essential when exporting the data.
-
How to Return Pandas DataFrame dtypes as a Dictionary
Using a dictionary to set the data types for a Pandas DataFrame gives you greater control over the schema.
-
How to Compare Two Pandas DataFrame Columns
Comparing columns in a DataFrame is essential when trying to concatenate two Pandas DataFrames with a lot of columns.
-

How to Pull Jira using JQL with Python and Pandas
In this post, I’ll walk you through pulling Jira issues from the API using JQL with Python Pandas.
-

How to Install Spark on Google Colab
Installing Spark on your local machine can be a pain. In this post, I’ll show you how to install Spark on Google Colab so that you can easily get going with PySpark.
-
How to Easily Scrape data with Python from a Website that Requires a Login
-
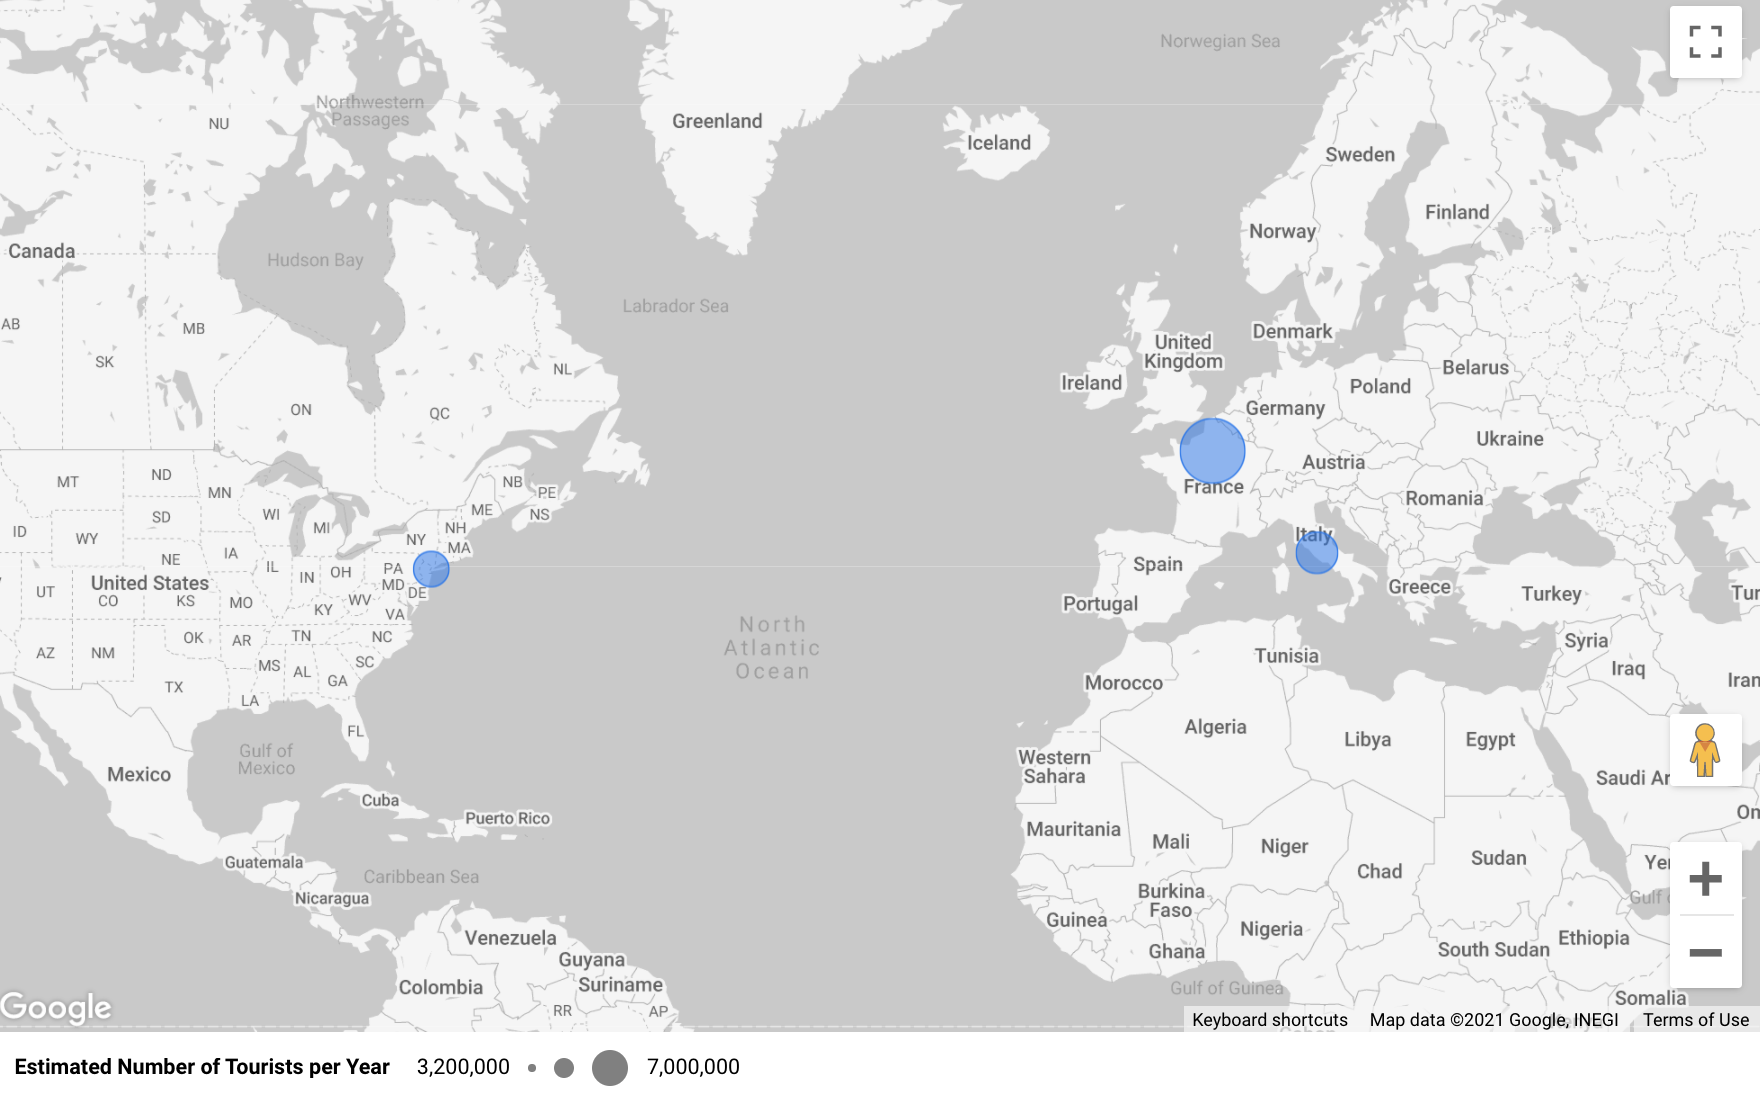
How to Plot Geo-Spatial Data in Google Data Studio using Latitude and Longitude
Google Data Studio makes it so easy to take address data and convert it into an interactive map.