Category: Python
-
Easily Create One Pandas DataFrame from Mulitple Excel Files
In this post, I’ll show you how you can quickly and easily read and combine multiple excel files into one Pandas DataFrame.
-

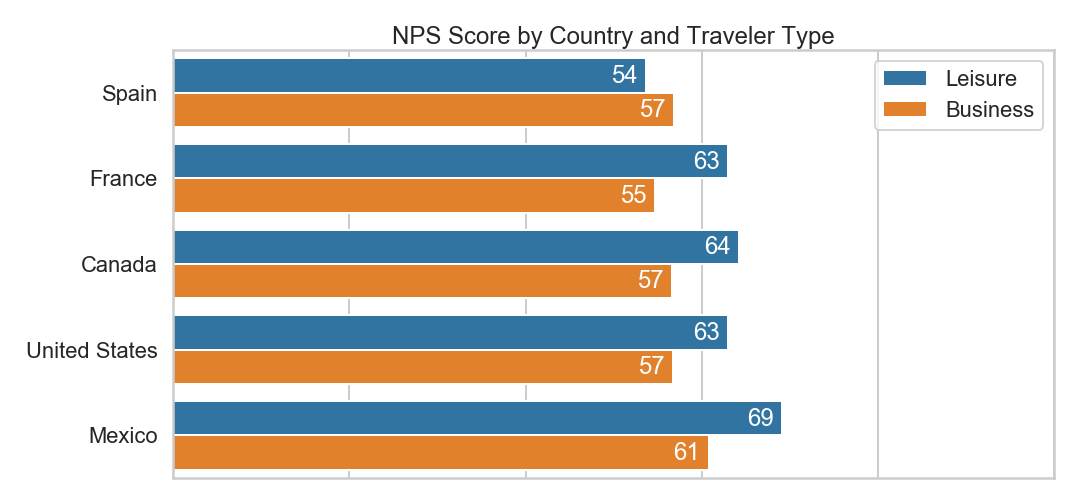
How to Calculate a Net Promoter Score (NPS) using Python
The Net Promoter Score has become a popular way to analyze survey data. Instead of calculating a straight average for 0 through 10 scores, scores are bucketed into Detractors, Passives, and Promoters. In this post, I’ll use the Net Promoter Score methodology and apply it to a dataset of raw scores using Python.
-
How to Set a Blank or Null Date using the Simple Salesforce Python Package
Dates are tricky are in Salesforce and in this post I will walk you through how to set a date to Blank or Null using the Simple Salesforce Python Package.
-

How to Automatically Create a Series Subplots from a DataFrame using a For Loop in Python
I have found that using a For Loop to create a series of subplots allows for greater flexibility to customize the individual plots compared to using the Pandas plot function. In this post, I’ll show you how to use a For Loop to create individual subplots and axes variables from a single Pandas DataFrame.
-

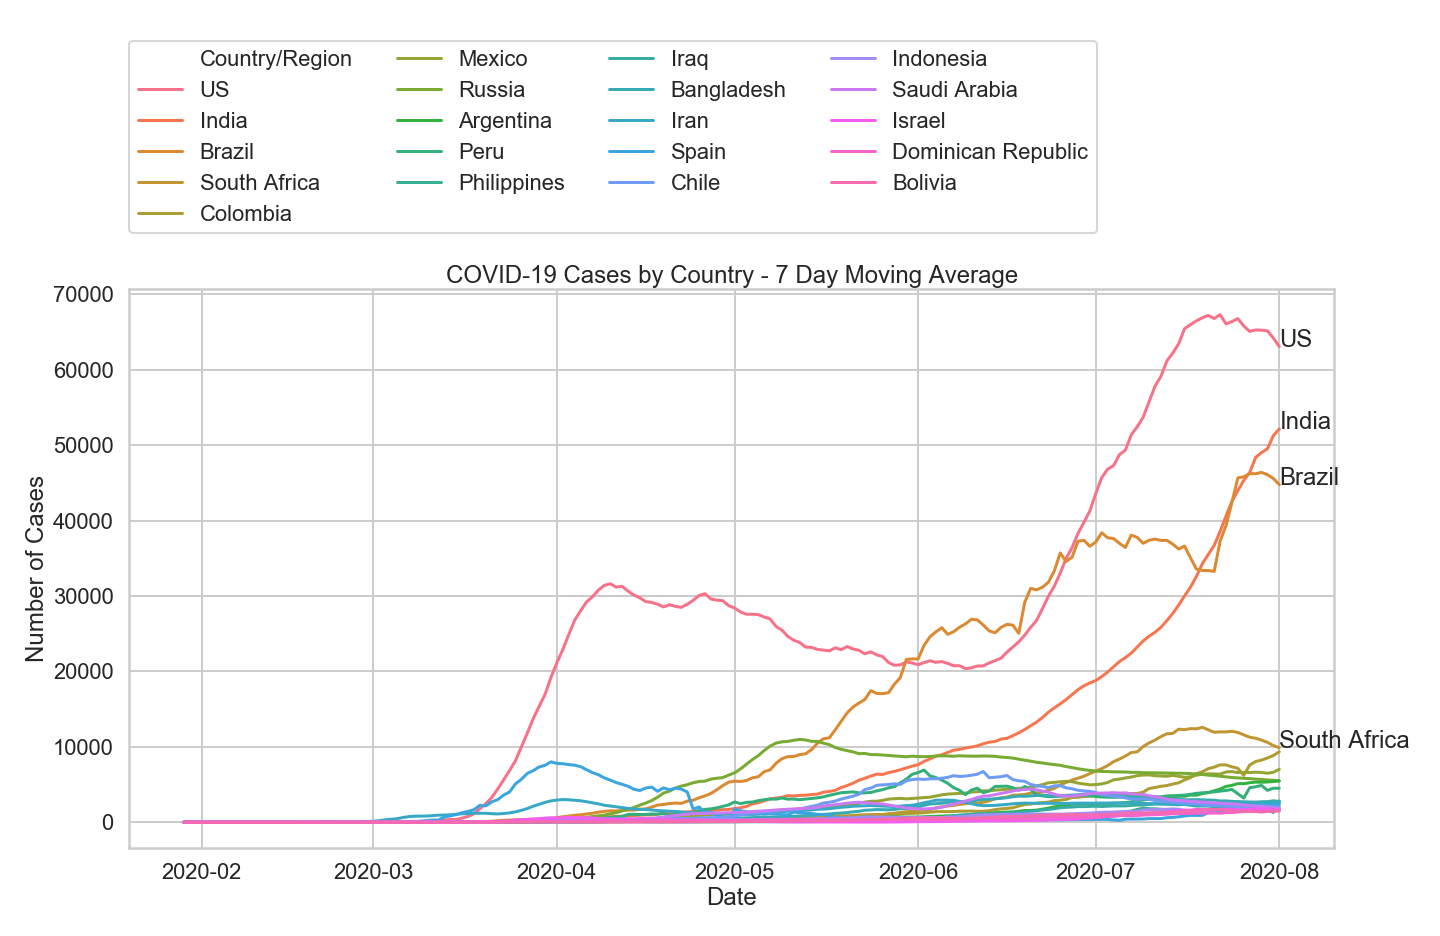
Analyzing COVID-19 Data in Python
In this post I’ll walk through pulling COVID-19 data, cleaning it, and then visualizing it.
-
How to Connect Python to a Remote MySQL Database with SSH Encryption
In this post, I’ll show you how to connect Python to a remote MySQL database that has SSH encryption.
-

Sending an HTML Formatted Email with Attachments through Gmail using Python
In this post, I will walk through sending HTML formatted emails with inline images and attachments.
-
How to Store Passwords in a Bash Profile and Retrieve Them in a Python
In this post, I’ll show you how to create an environment variable so that you don’t have to write your passwords directly into your code. This will keep your passwords safe and prevent you from accidentally sharing your credentials with others.
-
Convert Y-axis Labels to a Percentage in Python Matplotlib
The matplotlib.ticker library provides an easy way to convert the y-axis number formatting in Matplotlib. Here’s how to turn a decimal y-axis and display them as a percentage.
-
Plotting a Pandas Pivot Table in Python
Plotting data that is organized into pivot table has a slightly different syntax than plotting a columns in a dataframe.