Leverage Google Maps API or Nominatim in Python to return complete address information that you can use for geo charts.
All the code for this post can be found in this Google Colab Notebook.
Why you would need more complete address information
- You need latitude and longitude but only have an address or place name
- You need the complete address but only have a partial address or place name
- You want to standardize address data that has inconsistent formats or data that may have come from different sources
- You want to chart geographical data using a map chart
Returning address information using the Google Maps API
The Google Maps API is my go-to library for returning complete address information. I find that the output is the most accurate and gives the most consistent results. The drawback of using the Google Maps API is that there may be a fee for running your code if you have a lot of address data. Regardless of your data size, you have to set up a billing account with Google Cloud and activate the Google Maps API. However, there is a pretty generous free tier which you can check out here.
To get started, you’ll need to sign up for a Google Cloud account. After that, you’ll need to do the following:
- Get an API key by following these instructions.
- Enable the Geocoding API. You can simply search for it using the top menu search bar in the Google Cloud Console.
If you want to keep your API key secret (which I recommend that you do), then create a separate file called python_creds.py and save your API key in it.
google_api = 'api_key'
This is how we can do environmental variables in Google Colab. Remember where you placed the folder in your Google Drive because you will need to reference it.
Now we are ready to run some Python code. Here’s a code snippet that shows how easy it is to load up the library and return the complete address information:
from geopy.geocoders import GoogleV3

#python_creds.py file format:
#google_api = 'api_key'

import sys
sys.path.append('/content/drive/MyDrive/Python')
import python_creds

from geopy.geocoders import GoogleV3
geolocator = GoogleV3(api_key=python_creds.google_api)

#Example
address = geolocator.geocode("Empire State Building")
address
The output of the above results in: Location(20 W 34th St, New York, NY 10001, USA, (40.7484405, -73.98566439999999, 0.0))
To get all the address information, you can run address.raw
Returning address information using Nominatim
Setting up a Google Billing Account can be a little daunting, especially if your requirements are pretty simple and your data set is small. A quick way to get started is to use the Nominatim API along with the GeoPy library. Nominatim is an open-source geocoding service. The drawback of this approach is that the output isn’t always consistent or what you would expect for the given input.
# Importing Libraries
!pip install geopandas
!pip install geopy
import geopandas as gpd
import geopy
from geopy.geocoders import Nominatim
from geopy.extra.rate_limiter import RateLimiter

import pandas as pd
import numpy as np

#Setting up Nominatim
locator = Nominatim(user_agent="my-application", timeout=20)
rgeocode = RateLimiter(locator.reverse, min_delay_seconds=0.001)

#Example
address = locator.geocode("Empire State Building")
address
The output is very similar to what the Google API will return: Location(Empire State Building, 350, 5th Avenue, Manhattan Community Board 5, Manhattan, New York County, New York, 10018, United States, (40.748428399999995, -73.98565461987332, 0.0))
Working with Addresses in a Pandas DataFrame
Typically I find myself working with large data sets of addresses rather than a singular address. In this section, I’ll walk you through working with address data in a Pandas DataFrame.
Here’s an example Pandas DataFrame:
import pandas as pd

df = pd.DataFrame(['Empire State Building','Eiffel Tower','Colosseum'],columns=['Location'])
df

Next, I’ll set up a function that we can use to return the complete address information for each row of the DataFrame:
def location_info(x):
  data = locator.geocode(x).raw #use this line when using Nominatim
  #data = geolocator.geocode(x).raw #use this line instead when using Google to perform the lookup
  data_converted = pd.json_normalize(data).squeeze() #squeeze converts a dataframe to a pandas series
  return data_converted
Please note that you will either use line 2 or 3 depending on whether you are using Nominatim or Google, respectively.
I will now apply the function to our DataFrame:
location_info_df = df['Location'].apply(location_info)
location_info_df

Finally, I will combine the address data back to the original DataFrame:
df_locations = pd.concat([df,location_info_df], axis=1)
df_locations
Interactive Geo Plots
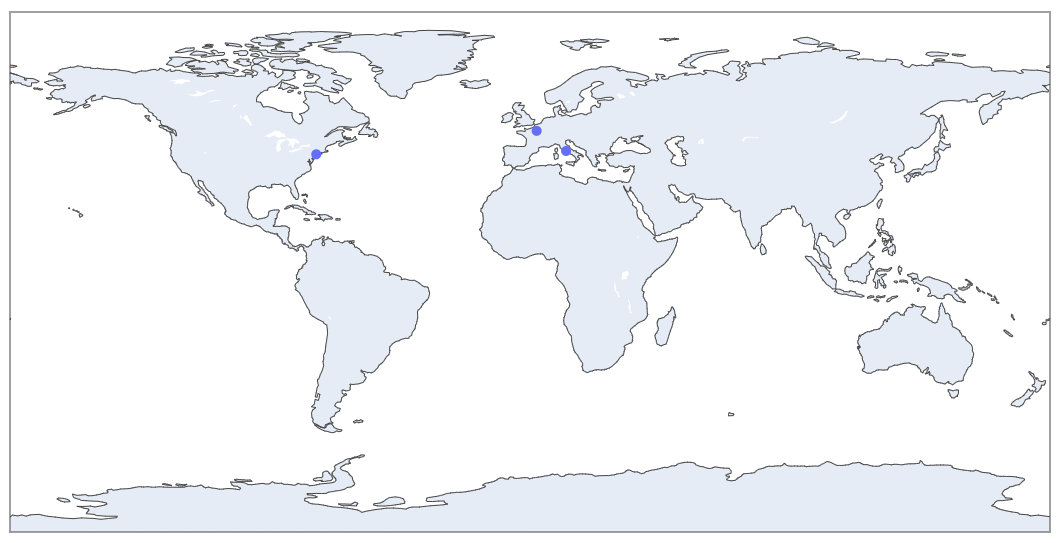
Plotting the data is really easy now that we have the complete address information.
If you want to stay in Python, I highly recommend using Plotly Express. Here is how we can take the data from the DataFrame and chart it below using the latitude and longitude:
import plotly.graph_objects as go
import plotly.express as px

fig = go.Figure()

fig.add_trace(go.Scattergeo(
    lon = df_locations['lon'],
    lat = df_locations['lat'],
    text = df_locations['Location'],
    marker = dict(
            size = 10)
))

fig.update_layout(
    title_text = 'Geo Scatter Plot',
    height = 800,
    width = 1200,

)

fig.show()
Another great option for charting is using Google Data Studio which is also free.
Final Thoughts
Check out more Python tricks in this Colab Notebook or in my recent Python Posts.
Thanks for reading!
