Data Analytics Simplified
Automate Smarter. Scale Faster.
Welcome to Data Analytics Simplified, a blog dedicated to helping you streamline data workflows, automate processes, and scale your infrastructure—without the headaches. Whether you’re battling messy spreadsheets, inefficient pipelines, or trying to get the most out of your data analytics investments, you’re in the right place.
Why You’re Here:
- Your Data Outgrew Your Infrastructure: Your setup worked for a while, but now it’s bursting at the seams. It’s time to upgrade, streamline, or rebuild entirely.
- Your Analytics Aren’t Delivering: You’ve invested in analytics tools and tech, but the results are underwhelming. You need insights, not excuses.
- You’re New to the World of Data: You’re navigating the complexities of data engineering for the first time and need practical, actionable advice to get started.
What You’ll Get:
I’ll share proven strategies, tips, and frameworks from my experience in data engineering and analytics, focusing on:
- Automation: Save time and reduce errors with automated workflows and processes.
- Operational Efficiency: Improve the scalability and reliability of your data infrastructure.
- Practical Problem-Solving: Explore innovative tools and technologies that get the job done efficiently and cost-effectively, without the need for overly complex or tailored solutions.
Data doesn’t have to be overwhelming. With the right approach, you can declutter, optimize, and build a solid foundation for data science and analytics.
Let’s get to work.
Recent Posts
-
How to Flatten MultiIndex Columns into a Single Index DataFrame in Pandas
Sometimes it’s just easier to work with a single-level index in a DataFrame. In this post, I’ll show you a trick to flatten out MultiIndex Pandas columns to create a single index DataFrame.
-
How to Refresh an Imported Python File in a Jupyter Notebook
If you have imported a python file and later make changes to it, you’ll need to reload it in your Jupyter Notebook to take advantage of any recent changes.
-
Creating a Random or Test DataFrame in Pandas
Having random or test data is a great way to test out various functions before applying them to actual data. Here are a few ways to generate random or test data in pandas.
-
How to Combine Multiple Excel Files using Python
Easily and quickly combine multiple excel files that contain the same type of data.
-
How to use Google Sheets as a Basic Web Scrapper
Easily and automatically capture data from websites using some built-in functionality in Google Sheets.
-
Leverage Subqueries in SQL for Dynamic and Efficient Queries
Using subqueries in SQL is a trick that can be used to make a query dynamic or greatly decrease the execution time of a query. In this post, I’ll show you two tricks I use often to make my queries more efficient.
-
Why Indexing in SQLite will Dramatically Improve the Performance of a Query
I recently created my own SQLite database to do a one-off analysis on a special project. My database was pretty simple and had a couple of very large tables that consisted of millions of rows.
-
Easily Create One Pandas DataFrame from Mulitple Excel Files
In this post, I’ll show you how you can quickly and easily read and combine multiple excel files into one Pandas DataFrame.
-
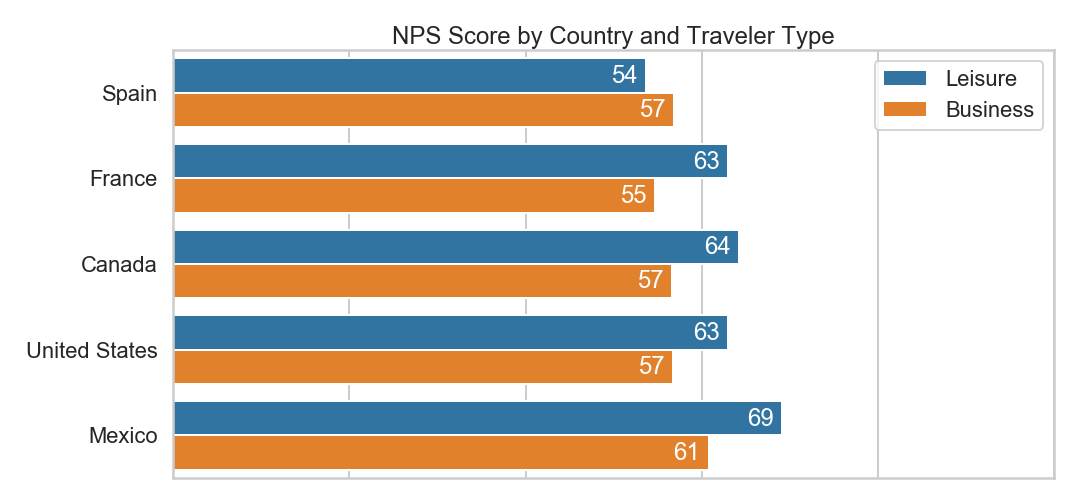
How to Calculate a Net Promoter Score (NPS) using Python
The Net Promoter Score has become a popular way to analyze survey data. Instead of calculating a straight average for 0 through 10 scores, scores are bucketed into Detractors, Passives, and Promoters. In this post, I’ll use the Net Promoter Score methodology and apply it to a dataset of raw scores using Python.