Data Analytics Simplified
Automate Smarter. Scale Faster.
Welcome to Data Analytics Simplified, a blog dedicated to helping you streamline data workflows, automate processes, and scale your infrastructure—without the headaches. Whether you’re battling messy spreadsheets, inefficient pipelines, or trying to get the most out of your data analytics investments, you’re in the right place.
Why You’re Here:
- Your Data Outgrew Your Infrastructure: Your setup worked for a while, but now it’s bursting at the seams. It’s time to upgrade, streamline, or rebuild entirely.
- Your Analytics Aren’t Delivering: You’ve invested in analytics tools and tech, but the results are underwhelming. You need insights, not excuses.
- You’re New to the World of Data: You’re navigating the complexities of data engineering for the first time and need practical, actionable advice to get started.
What You’ll Get:
I’ll share proven strategies, tips, and frameworks from my experience in data engineering and analytics, focusing on:
- Automation: Save time and reduce errors with automated workflows and processes.
- Operational Efficiency: Improve the scalability and reliability of your data infrastructure.
- Practical Problem-Solving: Explore innovative tools and technologies that get the job done efficiently and cost-effectively, without the need for overly complex or tailored solutions.
Data doesn’t have to be overwhelming. With the right approach, you can declutter, optimize, and build a solid foundation for data science and analytics.
Let’s get to work.
Recent Posts
-
How to Return Multiple Columns from Pandas using the Apply Function
Here is how you can return multiple pandas columns from an apply function.
-
Dynamically Create Pandas DataFrames from a List of Files using a Dictionary and a For Loop
-
How to Download Plotly Express Charts as Images in Google Colab
You’ll need to run the following commands to download a Plotly Express chart as an image when using Google Colab.
-
How to Send a File to an SFTP Server using Python
If you need to send a file to an SFTP server, you can easily do that with Python. In this post, I’ll show you how.
-
How to Apply a Forward Fill ffill() to Groups in Pandas
In this post, I’ll show you how to apply a forward fill using the ffill() function in pandas and only apply the transformation to a specified grouping.
-
How to Remove or Prevent Duplicate Columns From a Pandas Merge
In this post, I’ll show you three methods to remove or prevent duplicate columns when merging two DataFrames.
-
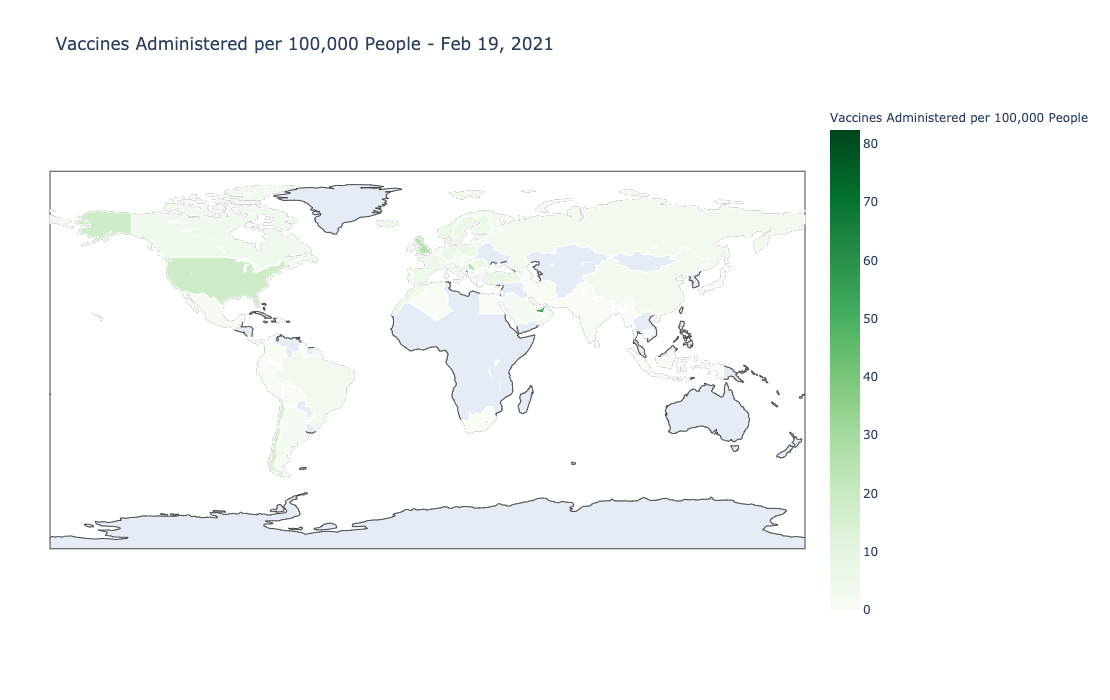
Analyzing COVID-19 Vaccine Rollout Data
In this post, I’ll take a look at the data from Our World in Data to visualize data from the COVID-19 vaccine rollout.
-
Speed up Long-Running SQL Queries Using a For Loop in Python
If you have a long-running query, splitting it up into smaller queries can help with performance. With Python, we can dynamically loop through each query.
-
How to Compare Two Python Lists and Return Items that Appear in Both Lists
In this post, I’ll show you how to return the common list items between two lists in Python.